

Census Bureau: 2013 uninsured rate was 13.4% (42 million total)
Tue, 09/16/2014 - 10:23am
As expected, right on the heels of the CDC report comes the Census Bureau report:
The percentage of people without health insurance coverage for the entire 2013 calendar year was 13.4 percent; this amounted to 42.0 million people.
Remember, that's before any of the ACA exchange enrollments took effect starting in January 2014, and is also before any Medicaid expansion took effect (also January 2014 for most states; Michigan didn't start until April, and New Hampshire didn't start until July).
It's important to note that the Census Bureau has changed their methodology with this report, so it's difficult to do a true "apples to apples" comparison with prior years. However, they do include the following note:
According to the American Community Survey, the percent of people without health insurance coverage declined 0.2 percent between 2012 and 2013.
This is important because while the ACA exchanges and Medicaid expansion didn't kick in until 2014, other provisions of the ACA (primarily the "under26ers on their parents plans" part, among others) have been quietly put into place since as early as mid-2010. While 0.2% doesn't sound like much, that's actually a net uninsured drop of 628,000 people from 2012 - 2013. How much of that is thanks to the ACA (vs. a general drop in the unemployment rate) is open to debate, but either way it's a Good Thing.
In any event, the 42 million figure impacts a lot of the other numbers I've been using, many of which are based on the Kaiser Family Foundation's prior 2013 estimate of 47.6 million.
The other thing that's important to note is that the various studies--including the just-released CDC report--are generally based on the adult uninsured population under 65. In other words, the "percent uninsured" given may only include those from 19-64 years old (about 198 million people), whereas the 13.4% in the new Census Bureau report includes everyone in the country.
So, what does this mean for the current situation? Well, for one thing, it means that the 4-5 percent point drop in the total adult uninsured population should reflect roughly a 20-25% drop in the overall uninsured number...or by around 8.4 - 10.5 million.
On the one hand, the reduction in raw numbers is slightly lower than I had previously estimated. On the other hand, that's only because I was basing that 20-25% on 47.6 million, not 42 million. In any event, this should mean that as of September, the current uninsured total should be down to around 31.5 - 33.6 million, give or take.
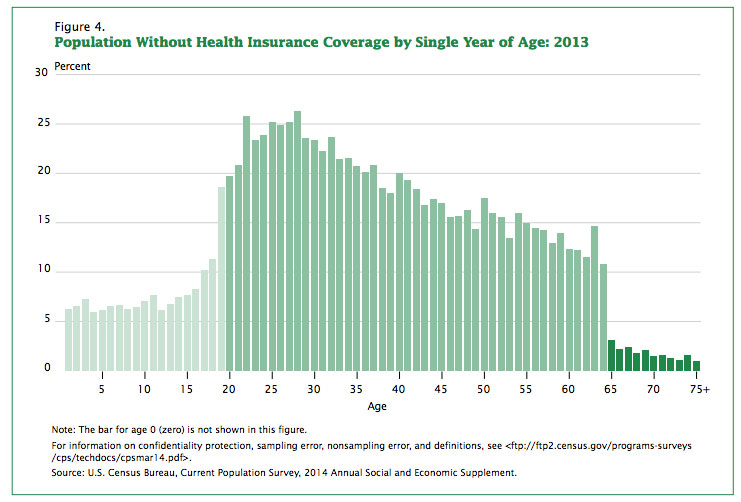
As an aside, thanks to Margot Sanger-Katz for providing this fascinating age-bracket breakdown chart of the 2013 uninsured population, which shows how dramatically Medicare, Medicaid and CHIP impact insurance rates:
Advertisement