SACRAMENTO, Calif. — Covered California announced on Thursday that executive director Peter V. Lee has informed the board that he will leave the organization in early 2022. Lee has served as Covered California’s first and only executive director, helping launch the exchange in 2012 and leading the organization that has provided millions of Californians with access to affordable, quality health coverage.
“I’ve been privileged to be part of the Covered California team and the broader effort in this state to do everything we can to use the Affordable Care Act to expand coverage and ensure those with coverage get the right care at the right time,” Lee said. “I will be stepping down as Covered California’s executive director after the upcoming open-enrollment period, with pride and confidence in the team at Covered California, who have taught me so much and who are poised to continue our important work.”
Methodology reminders, including some important updates:
I go by FULLY vaccinated residents only (defined as 2 doses of the Pfizer or Moderna vaccine or one dose of the Johnson & Johnson vaccine).
I base my percentages on the total population, as opposed to adults only or those over 11 years old.
For most states + DC I use the daily data from the Centers for Disease Control, but there are some where the CDC is either missing county-level data entirely or where the CDC data is less than 90% complete at the county level. Therefore:
For California, I'm using the CDC data for most counties and the state health dept. dashboard data for the 8 small counties which the CDC isn't allowed to post data for.
The 5 major U.S. territories don't vote for President in the general election, preventing me from displaying them in the main graph, but I have them listed down the right side.
NEW: Until now I've been using 2016 election data for Alaska; starting today, thanks to an updated analysis by RRH Elections, I'm finally able to use 2020 election results for Alaska (all other states +DC have been using 2020 county-level election data all along).
So, what does this mean for the final SEP push (again, it runs through 8/15 in most states)?
Well, it's hard to say, but I'd imagine it'll be a bit higher than the last week of July. That would mean something like ~220,000 more QHP selections via HC.gov states, and perhaps another 85,000 or so via the state-based exchanges (assuming they still make up roughly 28% of the national total). If so, that would put the final 8/15 tally at around 2.86 million new enrollees during the 2021 COVID SEP nationally (~2.05 million via HC.gov, ~808K via the SBMs).
Moments ago, via the HHS Dept (oddly, not via the Centers for Medicare & Medicaid (CMS), which usually publishes these enrollment reports):
Massachusetts, which is arguably the original birthplace of the ACA depending on your point of view (the general "3-legged stool" structure originated here, but the ACA itself also has a lot of other provisions which are quite different), has 9 different carriers participating in the individual market. MA (along with Vermont) has merged their Individual and Small Group risk pools for premium setting purposes, so I'm not bothering breaking out the small group market in this case.
Getting a weighted average for Massachusetts is trickier than in most states, for a couple of reasons. The good news is there's an August 2021 enrollment report which breaks out exactly how many MA residents are enrolled in each carrier's policies. However, the numbers are actually broken into 4 different categories: Small Group (which, again, is merged with the individual market in MA); "ConnectorCare" individual market policies; subsidized Qualified Health Plans and unsubsidized QHPs.
Health Carriers Propose Affordable Care Act (ACA) Premium Rates for 2022 Public Invited to Submit Comments
BALTIMORE – The Maryland Insurance Administration has received the 2022 proposed premium rates for Affordable Care Act products from health carriers. Health carriers are seeking a range of changes to the 2021 premium rates for plans sold in Maryland’s Individual Non-Medigap (INM) and Small Group (SG) markets in 2021.
Not much is changing next year--average individual market premiums will be dropping by 2.1%, while average small group rates will be going up 3.1%. There's a new entry into Maine's small group market (UnitedHealthcare of New England, not to be confused with UnitedHealthcare Insurance, which is already offering small group policies).
They break out the filings not between Individual and small group markets or on- vs. off-exchange policies, but between rate increases over and under 10%. Normally that would be fine, but they also have multiple listings within each market for several carriers; HMO Louisiana, in fact, has 11 entries, each for a different product line, making it tedious and difficult to piece together the weighted average rate change and current enrollment for the carrier as a whole.
In addition, it looks like the state regulators have given final approved rate changes for 2022 in some cases but not others...even within the same carrier and market.
As a result, my weighted averages below may be off somewhat.
With that in mind, it looks like Louisiana's individual market is looking at final average rate hikes of 4.75%, while their small group market carriers are seeking preliminary increases of around 6.9%.
Well, this was inevitable: I got so far behind on my annual ACA rate filing project that the final/approved rates have started to be released before I even get around to some of the preliminary/requested rate filings.
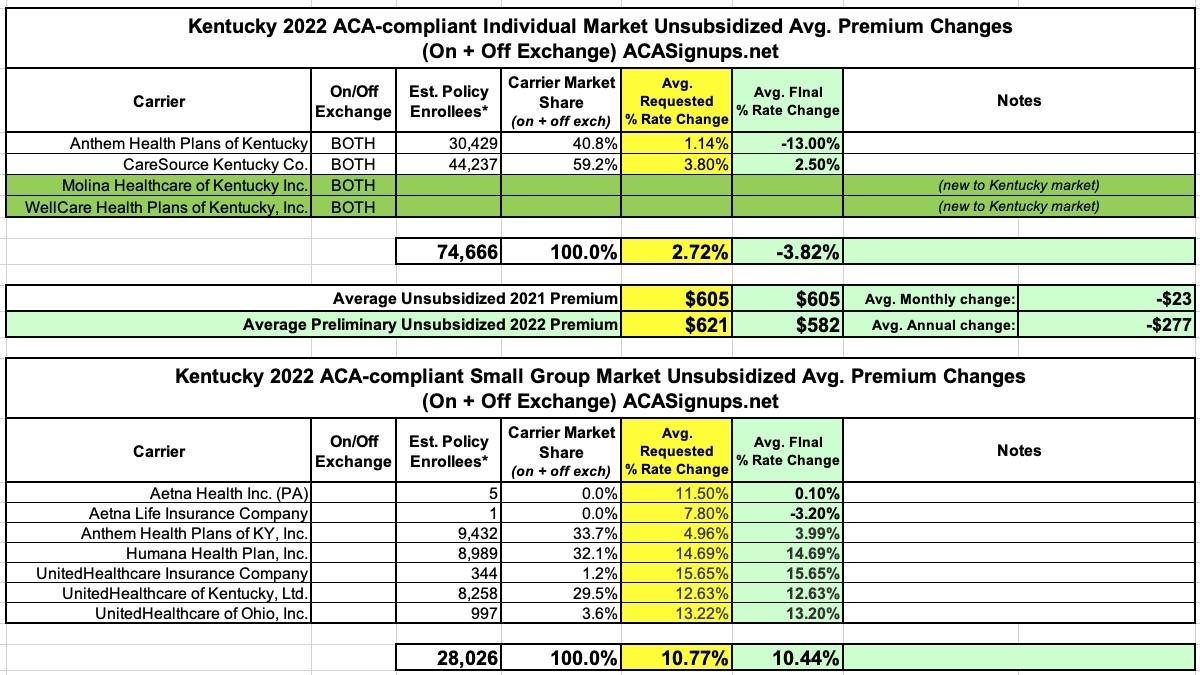
The Kentucky Insurance Dept. has posted both the requested and approved 2022 rate filings for the individual and small group markets, and in addition to drastically slashing the average premiums for Anthem's individual market offerings and Aetna's small group offerings, there's also two new entrants into Kentucky's individual market: Molina and WellCare.
Overall, individual rates are dropping by around 3.8% on average (the carriers had requested a 2.7% increase), while small group market plans are increasing by 10.4% on average (very close to the 10.7% average request).
Back in late July, I posted an analysis which looked at the COVID-19 vaccination rate across all 3,144 U.S. counties, parishes & boroughs by two additional criteria: Population Density and Urban/Rural Status.
As I noted at the time, it's reasonable to assume there might be a strong correlation by these criteria, since it's presumably a lot more difficult to get vaccinated if you live out in the middle of the boonies where the nearest hospital, clinic or pharmacy is 50 miles away or whatever...not to mention that if you're the only one for miles around, you might be less likely to see getting vaccinated as a high-priority task regardless of your ideology.
Therefore, the reasoning goes, instead of looking at the partisan lean of each county, it would make much more sense to see how much correlation there is based on population density or whether it's a more urban or rural region, right?